Remote Monitoring of Device behind NAT
When the device is located behind a NAT, you can configure it to periodically send monitoring reports to a third-party, remote HTTP-based monitoring server. This third-party server is configured on the device as a Remote Web Service (HTTP host), where the 'Type' parameter is set to Remote Monitoring. The device sends the reports over HTTP/S using RESTful API (in JSON format), where the device acts as the client.
You can choose to send various reports to the monitoring server:
|
■
|
Status reports: These reports contain status information of the device, for example, software version, network configuration (IP network interfaces, Ethernet port interfaces, and proxy addresses), IP Groups, and serial number). |
|
■
|
Active alarms reports: These reports contain currently active alarms. |
|
■
|
Key performance indicators reports: These reports contain performance monitoring statistics, for example, number of active SBC sessions, average call duration, and number of established inbound calls. |
|
■
|
Registration status reports: These reports contain status information of SIP User Agents (UA) currently registered with the device. |
If the device receives an HTTP failure response (4xx/5xx/6xx) from the Remote Web Service when it attempts to send it a monitoring report, the device raises the SNMP alarm, acRemoteMonitoringAlarm (with Warning severity level). This alarm is cleared only when it receives an HTTP successful response (2xx) from the server.
|
●
|
Currently, you can configure the device to send monitoring reports to only one Remote Web Service. |
|
●
|
If the report contains the more attribute with value "True", it means that the report has reached its maximum file size and the device will send another report with more information. The last report doesn't contain this attribute. |
|
➢
|
To enable remote monitoring of device behind NAT: |
|
1.
|
In the Remote Web Services table (see Configuring Remote Web Services), configure a Remote Web Service with the 'Type' parameter set to Remote Monitoring. |
|
2.
|
Open the Web Service Settings page (Setup menu > IP Network tab > Web Services folder > Web Service Settings). |
|
3.
|
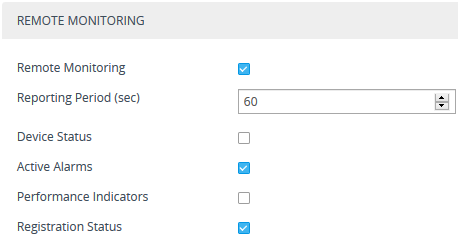
Select the 'Remote Monitoring' check box to enable the feature. |
|
4.
|
In the 'Reporting Period' field, configure the interval (in seconds) between each sent report. |
|
5.
|
Select the check boxes of the corresponding report types (information) that you want the device to send: |
|
●
|
'Device Status': Report contains status information of the device |
|
●
|
'Active Alarms': Report contains currently active alarms |
|
●
|
'Performance Indicators': Report contains performance monitoring statistics |
|
●
|
'Registration Status': Report contains information of users registered with the device |